Latitude vs. Cloudiness
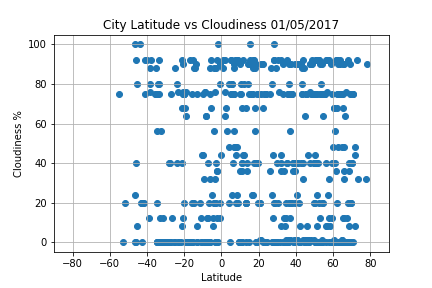
The latitude vs. cloudiness graphs shows data points all over, but the clusters are all due to the fact that the measuring system seems to be estimations since there isn't an exact way to measure the percentage of cloudiness.
Visualizations